Project 1.2

Analysis of P utilization using the host genome and microbiota variability in Japanese quail

Jörn Bennewitz / Amélia Camarinha-Silva

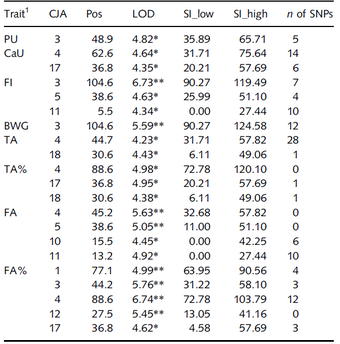
In a recent study, quantitative-genetic analyses of phosphorus (P) utilization in an F2 cross experimental design consisting of about 900 Japanese quails has been conducted. It estimated a narrow sense heritability of 14 percent. The individuals were genotyped with 4K SNP markers and lumen samples from the ileum were collected for microbiota analyses.

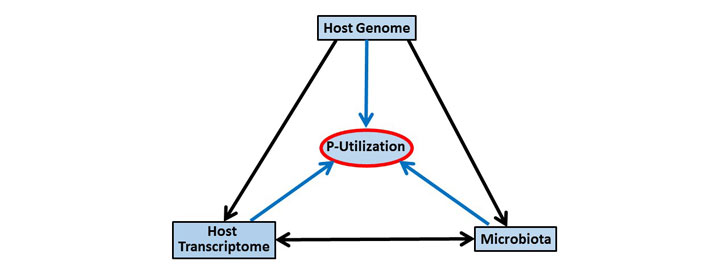
The overall aim of the present project is to obtain a better understanding of the P utilization observed in the study design considering the quail genetics, the quail ileum microbiota and the interplay between these two components. The aim is to test the following hypotheses.

  1. Variation of P utilization in quails is a heritable trait, which is controlled by few quail QTL with large effects.
  2. Variation of P utilization is partly driven by the microbial community in the ileum of the quail.
  3. The microbial community in the ileum is a heritable host trait that can be used for breeding individuals with improved P utilization.

Results

In the study Vollmar et al. 2020 the gut microbial architecture of feed-related traits phosphorus and calcium utilization, daily gain, feed intake and feed per gain ratio in the domestic poultry model species Japanese quail were assessed by mixed linear models. The ileum microbiota composition was characterized by 16S rRNA amplicon sequencing techniques of growing individuals. The microbiability of the traits was on a similar level as the narrow sense heritability and was highly significant except for calcium utilization. The animal microbial correlation of the traits was substantial. Microbiome-wide association analyses revealed several traits associated and highly significant microbiota features, both on the bacteria genera as well as on the operational taxonomic unit level. Most features were significant for more than one trait, which explained the high microbial correlations. It can be concluded that the traits are polymicrobial determined with some microbiota features with larger effects and many with small effects. The results are important for the development of hologenomic selection schemes for feed-related traits in avian breeding programs that are targeting the host genome and the metagenome simultaneously.

Results from the microbial linear mixed model (model 1), with microbial variance (σ²m), test-day variance (σ²td), residual variance (σ²e), and microbiability (m²) with p values (standard errors are in in parenthesis).

Phenotypic vs. animal microbial correlations. Phenotypic correlations (rpearson) and results from the bivariate microbial linear mixed model (bivariate extensions of model 1), with microbial covariance (σm1;m2), and microbial correlation (rm1;m2) with p values (standard errors are in in parenthesis).

A large F2 cross with 920 Japanese quail was used to map QTL for phosphorus utilization, calcium utilization, feed per gain and body weight gain in Vollmar et al. 2021. In addition, four bone ash traits were included, because it is known that they are genetically correlated with the focal trait of phosphorus utilization. Trait recording was done at the juvenile stage of the birds. The individuals were genotyped genome-wide for about 4k SNPs and a linkage map constructed, which agreed well with the reference genome. QTL linkage mapping was performed using multimarker regression analysis in a line cross model. Single marker association mapping was done within the mapped QTL regions. The results revealed several genome-wide significant QTL. For the focal trait phosphorus utilization, a QTL on chromosome CJA3 could be detected by linkage mapping, which was substantiated by the results of the SNP association mapping. Four candidate genes were identified for this QTL, which should be investigated in future functional studies. Some overlap of QTL regions for different traits was detected, which is in agreement with the corresponding genetic correlations. It seems that all traits investigated are polygenic in nature with some significant QTL and probably many other small-effect QTL that were not detectable in this study.

Plot of the QTL linkage mapping scan of growth and efficiency traits with LOD score test statistics. The green and red lines correspond to genome-wide significance levels of 5 and 1% respectively
Trait specific positions of significant QTL (Pos) on the chromosomes (CJA), LOD score test statistics (LOD) at the 1% (**) and 5% (*) genome-wide significance level, and the corresponding support intervals (SI). SI_low and SI_high = beginning and end of the support interval respectively, with the number (n) of significant SNPs identified by the association analysis